
Safidy Ratolonandrasana
Geophysical Survey, Processing, and Interpretation:Magnetic,Gravimetric, Electrical Method
GNSS Survey and Processing
Drone Photogrammetry Survey
Software Development
Geospatial Applications
Web Development
QGIS Developer: 2 plugins deployed
AI Model Training and Deployment
Technical Aspect of Law Of Sea
Equi Processing is a QGIS plugin. This plugin generates equidistant lines between two coastal states—either between two opposing coastal states or between two adjacent coastal states. Its primary purpose is to aid in the delimitation of marine boundaries between these states. The algorithm used is based on the Voronoi Diagram and follows the guidelines outlined for equidistance delimitation between opposing states in the TALOS (Technical Aspects of the United Nations Convention on the Law of the Sea) documentThe median line or the equidistance line is created by using :
Delaunay triangulation: about the algorithme.
TALOS guidelines: here
here is an other interactive Javascript implementation of the Fortune algorithm that computes Voronoi diagrams. We can visualize how space is divided based on point location
MEDIAN LINE OR EQUIDISTANT BETWEEN TWO OPPOSITES STATES
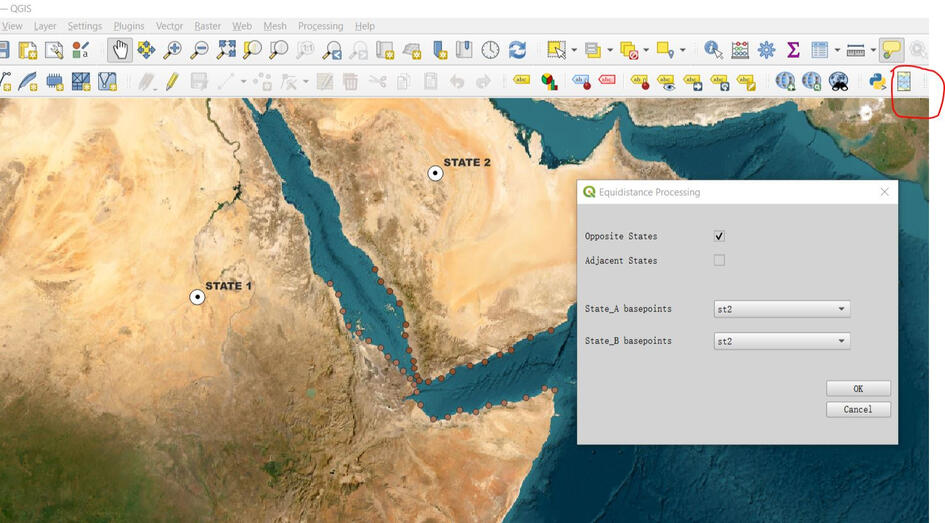
Choose option: Opposite States or Adjacent States
Select PB state_A: Baseline Points of the state A
Select PB state_B: Baseline Points of the state B
*
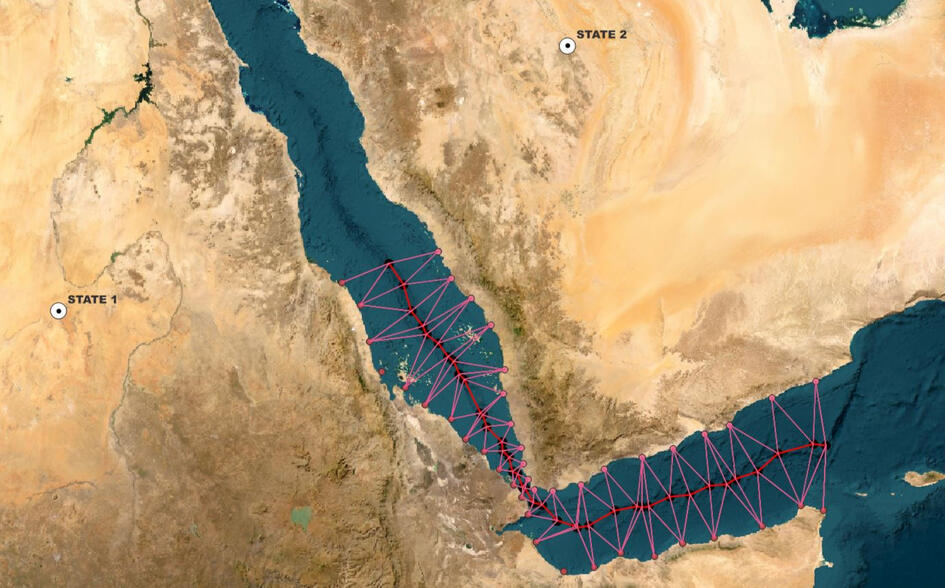
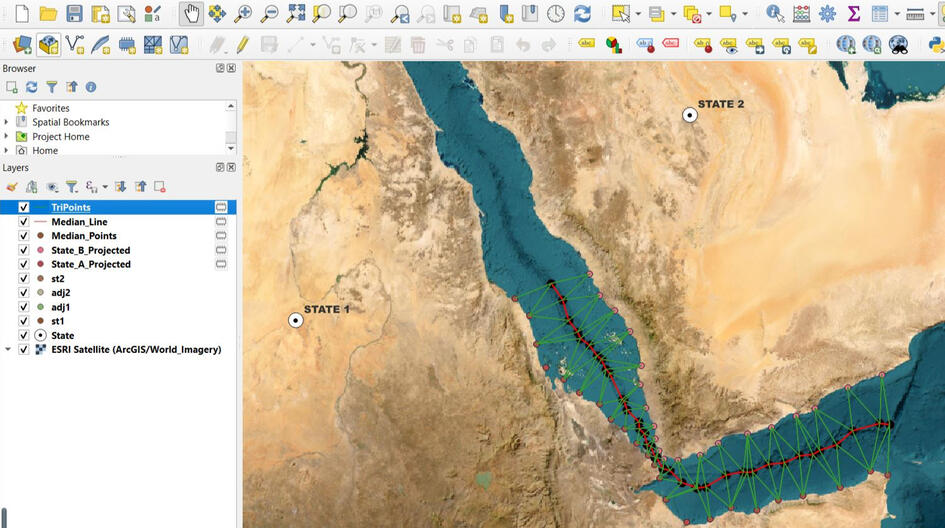
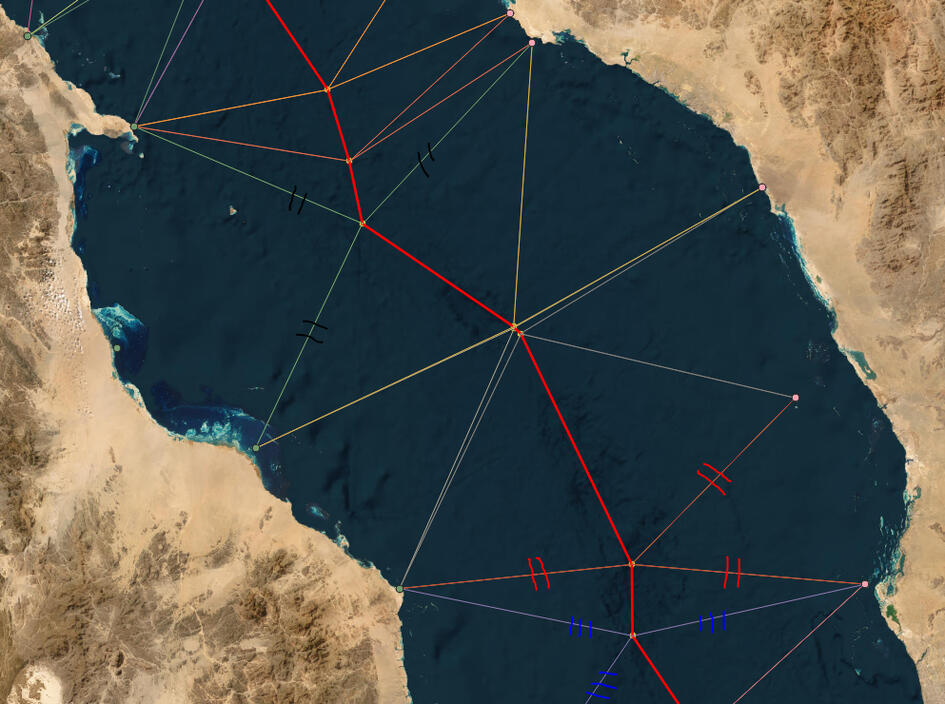
Tripoints: represents 3 lines from a Median Point that is equidistance to 3 BasePoints
Median_Line: is drawn using all Median Points and represents the Equidistance line
MEDIAN LINE OR EQUIDISTANT BETWEEN TWO ADJACENTS STATES
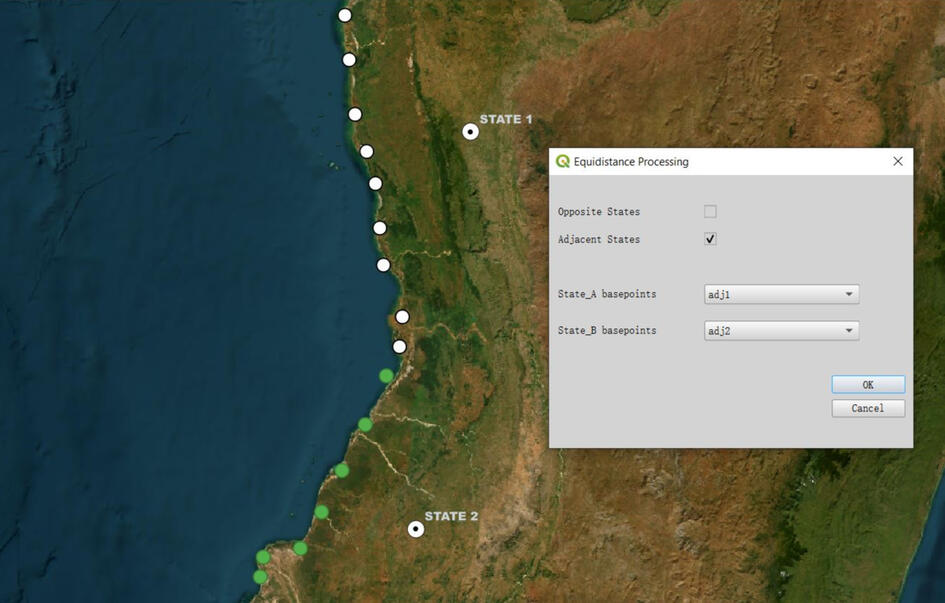
Choose option: Adjacent States
Select PB state_A: Baseline Points of the state A
Select PB state_B: Baseline Points of the state B
*
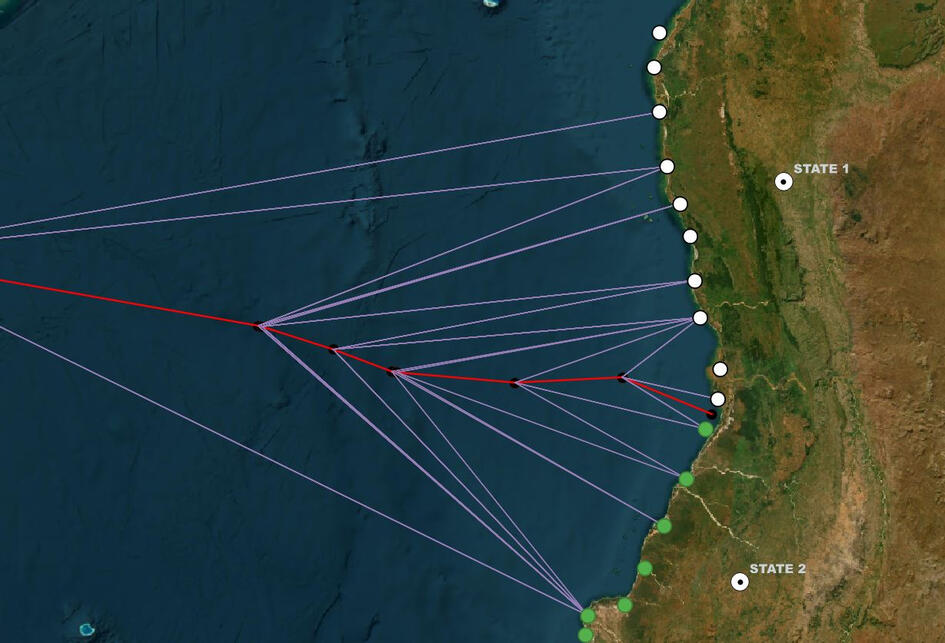
Tripoints: represents 3 lines from a Median Point that is equidistance to 3 BasePoints
Median_Line: is drawn using all Median Points and represents the Equidistance line
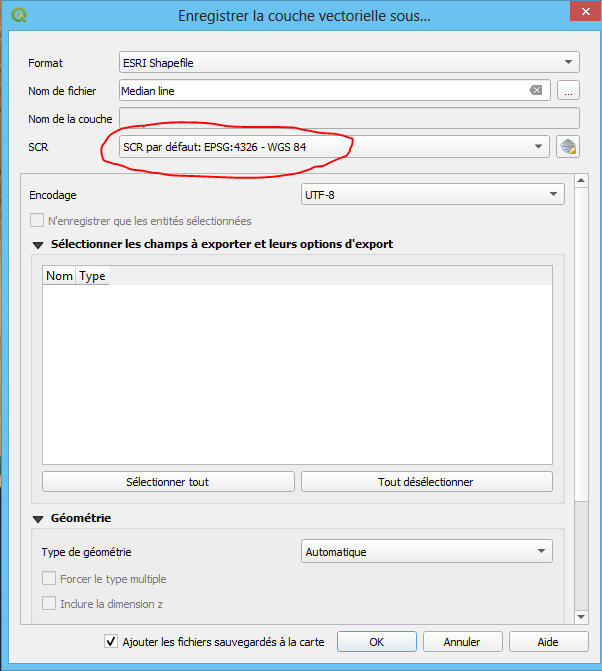
Coordinate Systeme:
When working with geographic data and geometry, it is important to use a projected coordinate system that preserves distances. The Universal Transverse Mercator (UTM) is a common choice, but working with data across multiple UTM zones can be complicated.Instead, the Transverse Mercator projection can be used, which is based on a user-defined base point location. The Transverse Mercator projection is the most widely used projected coordinate system for world topographical and offshore mapping, and has several different forms that all share the same basic characteristics and formulas. The differences between these forms arise from variations in the choice of coordinate transformation parameters, such as the latitude and longitude of the origin (central meridian), the scale factor at the origin (on the central meridian), and the values of False Easting and False Northing.The Transverse Mercator projection is designed to minimize distortion along the central meridian, which is chosen by the user of the projection as the reference line. All other points on the map are plotted relative to this line, with distortion increasing as one moves further away from it. This makes the Transverse Mercator projection well-suited for large-scale maps and mapping areas with significant east-west extent, such as countries or large continents.One example of the Transverse Mercator projection formula is:+proj=tmerc +lat0=-27.12 +lon0=32.92 +k=1 +x0=0 +y0=0 +ellps=WGS84 +towgs84=0,0,0,0,0,0,0 +units=m +no_defs +type=crsIn this example, the center of projection is determined at a latitude of -27.12 and a longitude of 32.92, automatically calculated from the data coordinates. This position marks the central point of the area covered by the data points, utilizing the WGS84 ellipsoid.Additionally, it's essential to highlight that the generated data is adaptable and can be exported into various coordinate reference systems, including WGS84 or others
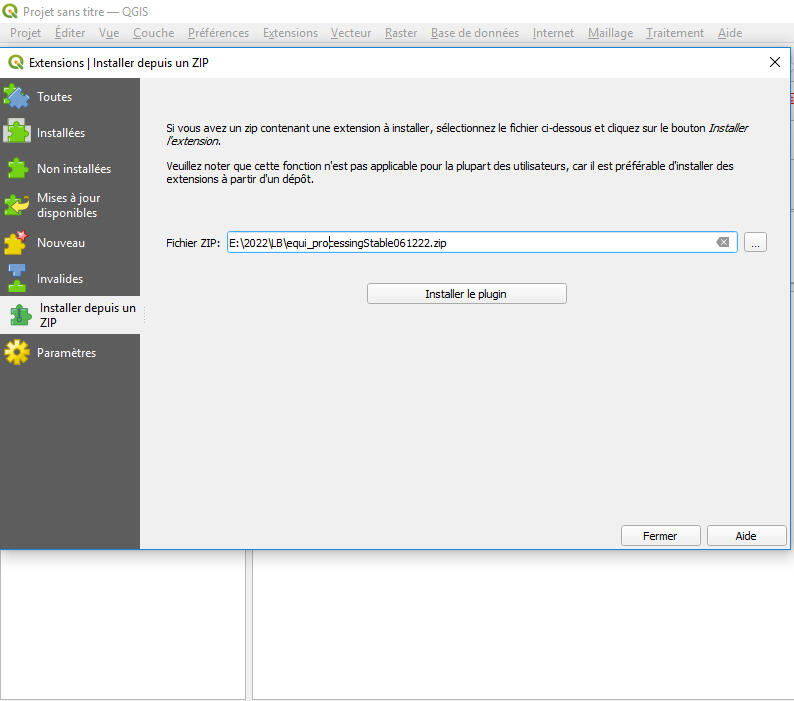
Download an install:
The Equi Processing plugin can be downloaded from the QGIS Plugin Repository here .
It can be installed either through the QGIS Plugin Manager or by downloading the plugin manually and installing it using the QGIS Plugin Installer.
It's important to note that the minimum version of QGIS required to run the plugin is 3.16.
"If you have any remark, don't hesitate to email me at: [email protected]. We thank you for your interest."
References:
- Franz Aurenhammer, Rolf Klein, Der-Tsai Lee: Voronoi Diagrams and Delaunay Triangulation. World Scientific, 2013
- Ivan Kutskir: Voronoi Diagram in JavaScript, 2009, accessed July 2020
- Methods of Maritime Outer Limits DelimitationChristos Kastrisios, Lt. H.N. MPS/GIS
- A manual on Technical Aspects of the united nations convention on the Law Of the Sea - 1982
Links:
https://github.com/qgis/QGIS/blob/master/python/plugins/processing/algs/qgis/VoronoiPolygons.py
https://docs.qgis.org/3.22/en/docs/developers_guide/index.html
https://github.com/gorhill/Javascript-Voronoi